How to Collect Event and Performance Data in Log Analytics
Today we continue with the Log Analytics post series. In the previous posts of this series, I showed you how to create a workspace for log analytics and how to deploy the log analytics. In this post, I will show you how to collect logs and metrics from VMs in your Log Analytics Workspace using Azure PowerShell. Prerequisites
- The Az.OperationalInsights module version 1.0.0 or later
- This tutorial assumes that you already have a Microsoft Azure account set up.
Azure PowerShell Workaround #
If you want to know how to install the PowerShell Azure module on your machine, check out this link. The simplest way to get started is to sign in interactively at the command line.
Connect-AzAccount
This cmdlet will bring up a dialog box prompting you for your email address and password associated with your Azure account. If you have more than one subscription associated with your mail account, you can choose the default subscription. To perform this task, we will use the following commands:
Get-AzSubscription
Select-AzSubscription -Subscription "My Subscription"
Once you set your default subscription, you’re ready to start.
Set the variables #
Here, we define the characteristics of our environment.
$resourceGroupName = "RG-DEMO"
$workspace = Get-AzOperationalInsightsWorkspace `
    -ResourceGroupName $resourceGroupName
Collect Windows Event Logs #
To collect event logs from our Windows VMs, we should use the New-AzOperationalInsightsWindowsEventDataSource cmdlet with the following syntax:
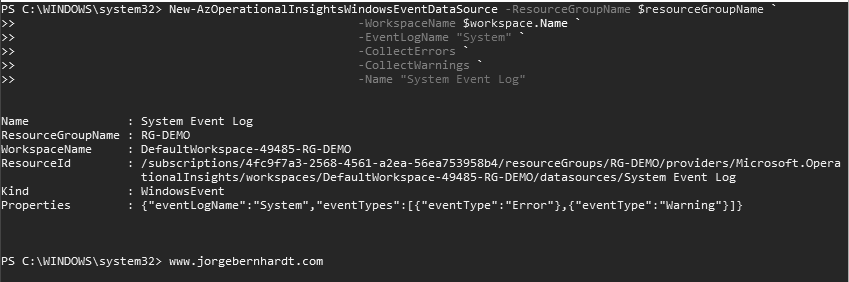
System Event Logs #
In the parameter -EventLogName we should specify the name of the event log, In this case, the “System” events logs. With the parameters -CollectErrors, -CollectWarnings and -CollectInformation, we must indicate what level of messages we want to collect.
New-AzOperationalInsightsWindowsEventDataSource `
    -ResourceGroupName $resourceGroupName `
    -WorkspaceName $workspace.Name `
    -EventLogName "System" `
    -CollectErrors `
    -CollectWarnings `
    -Name "System Event Log"
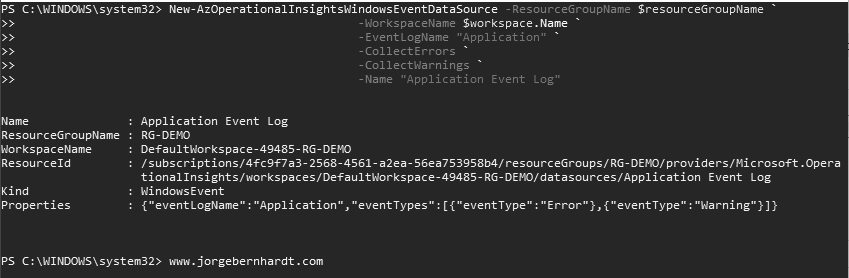
Application Event Logs #
unlike the previous example, in this case, we will collect application events.
New-AzOperationalInsightsWindowsEventDataSource `
    -ResourceGroupName $resourceGroupName `
    -WorkspaceName $workspace.Name `
    -EventLogName "Application" `
    -CollectErrors `
    -CollectWarnings `
    -Name "Application Event Log"
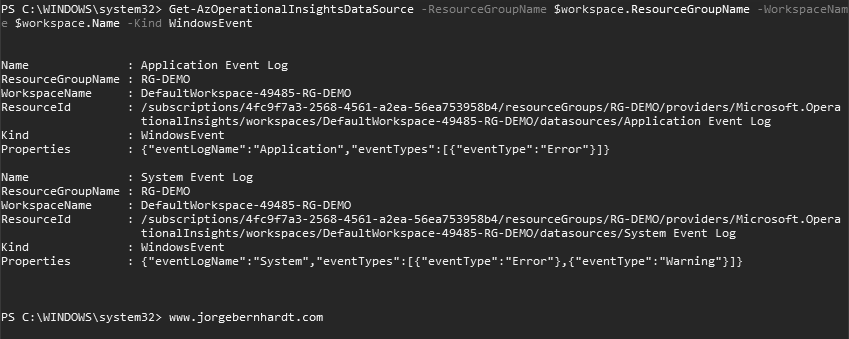
Get-AzOperationalInsightsDataSource `
    -ResourceGroupName $workspace.ResourceGroupName `
    -WorkspaceName $workspace.Name `
    -Kind WindowsEvent
Remove-AzOperationalInsightsDataSource `
    -ResourceGroupName $resourceGroupName `
    -WorkspaceName $workspace.Name `
    -Name "Application Event Log"
Collect performance counters #
To collect performance counters from our Windows VMs, we should use the New-AzOperationalInsightsWindowsPerformanceCounterDataSource cmdlet with the following syntax.
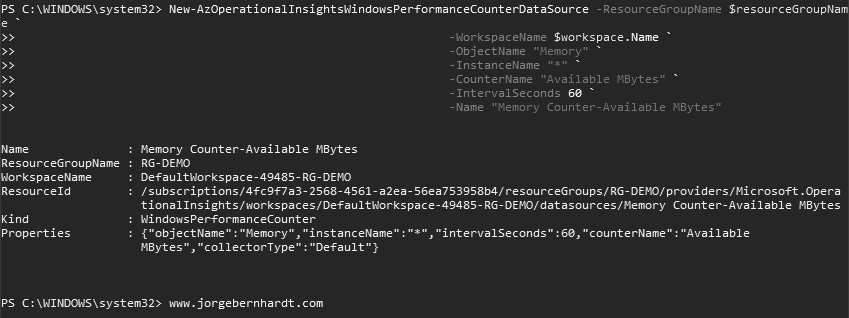
Memory Counter: Available MBytes #
with this command add a memory counter: MBytes available as a data source for computers running the Windows operating system. It is important to properly establish the intervals to keep costs under control. Keep in mind that performance counters generate a large amount of data.
New-AzOperationalInsightsWindowsPerformanceCounterDataSource `
    -ResourceGroupName $resourceGroupName `
    -WorkspaceName $workspace.Name `
    -ObjectName "Memory" `
    -InstanceName "*" `
    -CounterName "Available MBytes" `
    -IntervalSeconds 60 `
    -Name "Memory-Available MBytes"
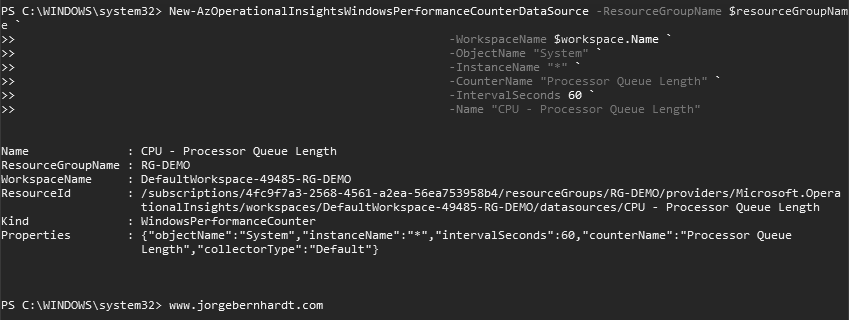
CPU Counter: Processor Queue Length #
With the following command, we set the processor counter as a data source.
New-AzOperationalInsightsWindowsPerformanceCounterDataSource `
    -ResourceGroupName $resourceGroupName `
    -WorkspaceName $workspace.Name `
    -ObjectName "System" `
    -InstanceName "*" `
    -CounterName "Processor Queue Length" `
    -IntervalSeconds 60 `
    -Name "CPU - Processor Queue Length"
Get-AzOperationalInsightsDataSource `
    -ResourceGroupName $workspace.ResourceGroupName `
    -WorkspaceName $workspace.Name `
    -Kind WindowsPerformanceCounter

Remove-AzOperationalInsightsDataSource `
    -ResourceGroupName $resourceGroupName `
    -WorkspaceName $workspace.Name `
    -Name "CPU - Processor Queue Length"
In the next post, I will show you how to write custom queries in Log Analytics.
If you want to know more about data sources in Log Analytics, check out this link.